Input Variable Maps
Non-forest Mechanical Treatment Potential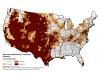 |
Sum of area available for mechanical treatment in non-forest. |
Non-forest Prescribed Fire Potential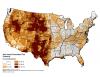 |
Percent area available for prescribed fire in non-forested landscapes. |
Percent Agriculture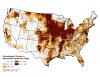 |
Percentage of county in Agriculture land-cover types |
Percent of County Area Within Interface 2000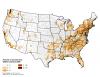 |
Percent of county area within interface 2000. |
Percent of County Area Within Intermix 2000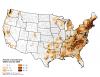 |
Percent of county area within intermix 2000. |
Percent of Hotspots Within a Wildfire Perimeter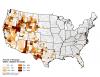 |
Percentage of hotspots within a wildfire perimeter. |
Percent of Population Over 25 With Bachelor's Degree or Higher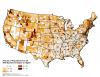 |
American Community Survey, 2005-2009, percent of population over 25 years of age with Bachelors degree or more. |
Percentage of Hotspots in PADUS Lands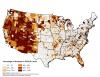 |
Percentage of hotspots in PADUS lands. |
Persistent Poverty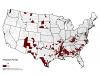 |
20 percent or more of residents in poverty as measured by each of the last 4 censuses, 1970, 1980, 1990, 2000, and 2010. |
Population Growth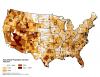 |
Annualized population growth from 1990-2010 |
Population Loss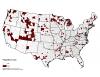 |
Counties where the number of residents declined both between the 1980 and 1990 censuses and between the 1990 and 2000 censuses. |
Prescribed Fire Potential (Forest and Non-forest)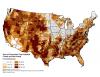 |
Sum of area available for prescribed fire, forest and non-forest. |