Input Variable Maps
Housing Density Within Intermix 2000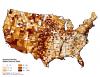 |
Housing density within intermix 2000. |
Housing Stress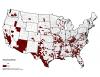 |
Counties where 30 percent or more of households had one or more of these housing conditions in 2000: lacked complete plumbing, lacked complete kitchen, paid 30 percent or more of income for owner costs or rent, or had more than 1 person per room in 2000. |
Ignition Density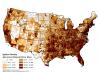 |
Maximum Number of reports per 100 sq. miles in a year. |
Incendiary (Arson) Area Burned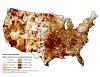 |
Mean annual area burned from incendiary causes, normalized by area. |
Incendiary (Arson) Fire Incidents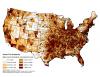 |
Mean annual number of incidents from incendiary causes, normalized by area. |
Index of 209 Structures Lost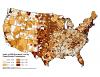 |
Index of structures lost per are burned, calculated for each combo class |
Index of Area Burned |
Index of area burned per unit area, calculated for each combo class |
Landscape Classes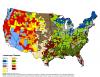 |
Landscape resiliency class. |
Low Educational Attainment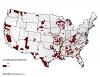 |
Counties with 25 percent or more of residents 25-64 years old with neither a high school diploma nor GED in 2000. |
Low Employment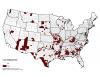 |
Counties where less than 65 percent of residents 21-64 years old were employed in 2000. |
Maximum Annual Acres Burned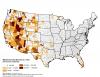 |
Maximum area burned in a single year (2002-2011), all sources combined |
Maximum Annual Acres Burned (Normalized)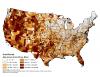 |
Maximum annual acres burned (2002-2011) and normalized by area. |