Input Variable Maps
209 Structures Lost (Number)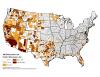 |
Cumulative structures lost 2002-2011 reported in 209 reports. |
209 Structures Lost (Rate)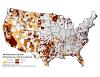 |
Structures Lost per 1,000 Acres burned, based on 209 data and State and Fed incidents |
Accidental Area Burned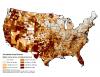 |
Mean annual area burned from unknown and accidental causes, normalized by area. |
Accidental Fire Incidents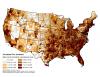 |
Mean annual number of incidents from unknown and accidental causes, normalized by area |
Annual Average Reported Federal Incidents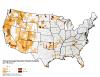 |
Annual average of reported federal incidents (per 100 sq mi). |
Annual Average Reported NFIRS Incidents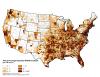 |
Annual average of reported NFIRS incidents (per 100 sq mi). |
Annual Average Reported State Incidents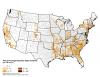 |
Annual average of reported state incidents (per 100 sq mi). |
Area Burned by Natural Ignitions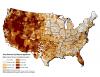 |
Area burned by fires started by natural causes, normalized by county area. |
Area Forested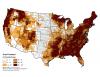 |
Percent of county area with forested landcover. This variable was used as an input to the Landscape Classes. |
Bailey's Ecoregions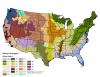 |
Bailey's ecoregion (modal value). |
Children Below Poverty Line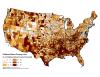 |
Children below the poverty line - Percentage of children in the county that are below the poverty threshold. |
Community Clusters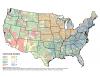 |
Community cluster based on eight clusters. |
Conservation Partners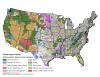 |
Primary conservation partner from the PADUS based on area managed. |
Demographic Advantage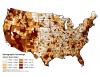 |
Demographic factor score of socioeconomic factors such as poverty rates, household income, population growth and educational attainment. |
Demographic Stress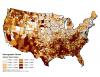 |
Demographic factor score of socioeconomic factors such as poverty rates, household income, population growth and educational attainment. |
Dominant Economic Activity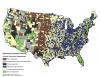 |
Dominant economic activity from the USDA Economic Research Service's ERS County typology codes. |
Estimated Prescribed Fire Activity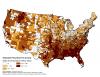 |
Estimated area burned in Rx fire, 2008-2011, based on hotspots and total area burned. Normalized by area. Units are log10[ac] per 100 sq mi. |
Families Below Poverty Line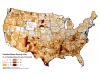 |
Families below the poverty line - Percentage of families in the county that are below the poverty threshold. The income threshold for poverty varies by family size, number of children and age of the householder. |
Federal 95th Percentile Fire Size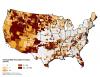 |
Federal 95th percentile fire size. |
Federal 99th Percentile Fire Size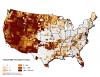 |
Federal 99th percentile fire size. |
Federal Annual Average of Area Burned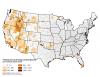 |
Federal annual average of area burned per hundred square miles. |
Federal Fires of Concern (Count)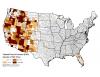 |
Federal Fires of Concern are fires that burned an area greater than 640 acres or that burned for a duration of at least 2 weeks. |
Federal Fires of Concern (Normalized)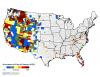 |
FOC fires of concern normalized by area (# per 100 sq mi). |
Federal Median Fire Size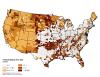 |
Federal median fire size. |
Federal Ownership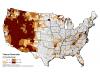 |
Percentage of county area in Federal ownership. |
Fire Stations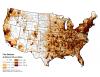 |
Number of fire stations per 100 sq. miles. |
Firefighter Injuries Reported (Total Number)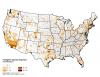 |
Total number of firefighter injuries reported. |
Forest Industry Jobs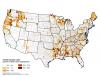 |
Forest industry jobs (% of total county employment) |
Forest Industry Jobs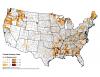 |
Forest industry jobs (% of total county employment) |
Forest Mechanical Treatment Potential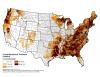 |
Sum of area available for mechanical treatment in forest. |
Forest Prescribed Fire Potential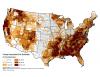 |
Percent area available for prescribed fire in forested landscapes. |
Forest Product Production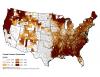 |
Index of forest product production. |
Hotspot Density in Mixed Natural Areas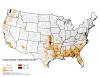 |
Hotspot density in mixed-natural areas. |
Hotspot Density in Natural Areas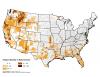 |
Hotspot density in natural areas. |
Hotspots Within Wildfire Perimeter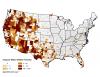 |
Count of hotspots within a wildfire perimeter. |
Housing Density Within Interface 2000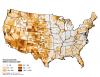 |
Housing density within interface 2000. |
Housing Density Within Intermix 2000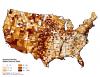 |
Housing density within intermix 2000. |
Housing Stress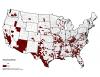 |
Counties where 30 percent or more of households had one or more of these housing conditions in 2000: lacked complete plumbing, lacked complete kitchen, paid 30 percent or more of income for owner costs or rent, or had more than 1 person per room in 2000. |
Ignition Density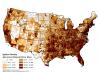 |
Maximum Number of reports per 100 sq. miles in a year. |
Incendiary (Arson) Area Burned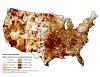 |
Mean annual area burned from incendiary causes, normalized by area. |
Incendiary (Arson) Fire Incidents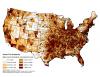 |
Mean annual number of incidents from incendiary causes, normalized by area. |
Index of 209 Structures Lost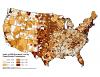 |
Index of structures lost per are burned, calculated for each combo class |
Index of Area Burned |
Index of area burned per unit area, calculated for each combo class |
Landscape Classes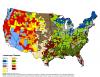 |
Landscape resiliency class. |
Low Educational Attainment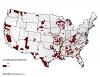 |
Counties with 25 percent or more of residents 25-64 years old with neither a high school diploma nor GED in 2000. |
Low Employment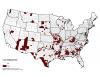 |
Counties where less than 65 percent of residents 21-64 years old were employed in 2000. |
Maximum Annual Acres Burned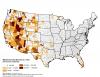 |
Maximum area burned in a single year (2002-2011), all sources combined |
Maximum Annual Acres Burned (Normalized)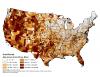 |
Maximum annual acres burned (2002-2011) and normalized by area. |
Maximum Fire Size Observed in Fire Occurrence Data Set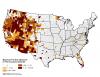 |
Maximum fire size observed in the Fire Occurrence Dataset |
Maximum Number of Fires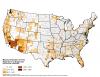 |
Maximum number of fires reported in a single year (2002-2011), all sources combined |
Mean Burn Probability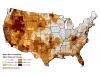 |
Burn Probability estimated from FSIM runs, 9-15-11 |
Mean Flame Intensity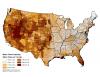 |
Mean FIL estimated using FSIM. |
Mean Urban Value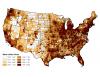 |
Average county value from the “Urbaness Index.” |
Median Income of Families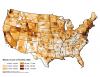 |
American Community Survey, 2005-2009, median income of families (USD). A family includes a householder and one or more individuals related to the householder by birth, marriage or adoption. |
Modal Fire Regime Group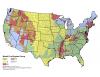 |
The historical Fire Regime Group with the highest occurrence for each county. |
Modal Hotspots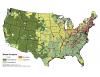 |
Landcover classification type with the most MODIS hotspots per county. |
Natural Fire Incidents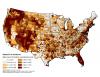 |
Mean annual number of incidents from natural causes, normalized by area. |
Natural Landscape |
Percent area in natural vegetation landcover. |
Natural-mixed Landscape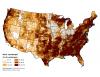 |
Percent area in mixed-natural vegetation landcover. |
NFIRS 95th Pct Arrival Time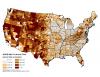 |
The 95th percentile arrival time for incidents reported in NFIRS. |
NFIRS 95th Percentile Fire Size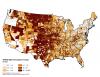 |
NFIRS 95th percentile fire size (reported in acres). |
NFIRS 99th Percentile Fire Size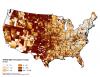 |
NFIRS 99th percentile fire size (reported in acres). |
NFIRS Annual Average Area Burned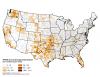 |
NFIRS Annual average of area burned per hundred square miles. |
NFIRS Buildings Involved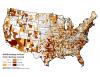 |
NFIRS Number of buildings involved. |
NFIRS Buildings Involved (Rate)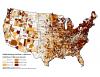 |
Number of buildings involved per 1000 acres, area burned as reported in NFIRS. |
NFIRS Fires of Concern (FOC) Area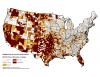 |
NFIRS fires of concern due to size (100 ac or larger). |
NFIRS Fires of Concern (FOC) Arrival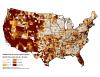 |
NFIRS fires of concern due to arrival time (longer than 30 min). |
NFIRS Median Arrival Time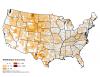 |
NFIRS median arrival time. |
NFIRS Median Containment Time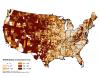 |
NFIRS median containment time. |
NFIRS Median Fire Size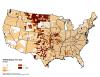 |
NFIRS median fire size (reported in acres). |
NFP Fuel Treatments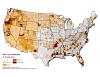 |
Cumulative area treated by federal agencies, relative to county area. |
NFPORS Acres Treated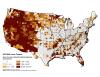 |
Sum of acres treated by the federal agencies and bureaus |
Non-forest Mechanical Treatment Potential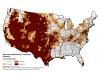 |
Sum of area available for mechanical treatment in non-forest. |
Non-forest Prescribed Fire Potential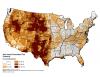 |
Percent area available for prescribed fire in non-forested landscapes. |
Percent Agriculture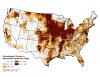 |
Percentage of county in Agriculture land-cover types |
Percent of County Area Within Interface 2000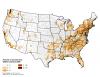 |
Percent of county area within interface 2000. |
Percent of County Area Within Intermix 2000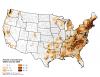 |
Percent of county area within intermix 2000. |
Percent of Hotspots Within a Wildfire Perimeter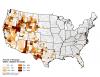 |
Percentage of hotspots within a wildfire perimeter. |
Percent of Population Over 25 With Bachelor's Degree or Higher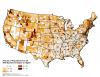 |
American Community Survey, 2005-2009, percent of population over 25 years of age with Bachelors degree or more. |
Percentage of Hotspots in PADUS Lands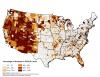 |
Percentage of hotspots in PADUS lands. |
Persistent Poverty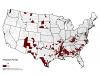 |
20 percent or more of residents in poverty as measured by each of the last 4 censuses, 1970, 1980, 1990, 2000, and 2010. |
Population Growth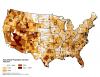 |
Annualized population growth from 1990-2010 |
Population Loss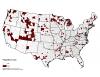 |
Counties where the number of residents declined both between the 1980 and 1990 censuses and between the 1990 and 2000 censuses. |
Prescribed Fire Potential (Forest and Non-forest)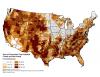 |
Sum of area available for prescribed fire, forest and non-forest. |
Protected Areas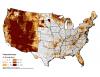 |
Percent of County area that is protected land or managed by a conservation partner. |
Response Persons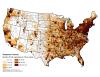 |
Number of first responders per 100 square miles. |
Roaded Area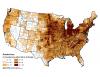 |
Percent of county within 540 m of roads. |
Socioeconomic Stress Index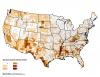 |
Index based on the sum of Persistent Poverty, Housing Stress, Low Employment, Low Educational Attainment, and Population Loss. |
State 95th Percentile Fire Size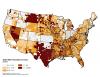 |
State 95th percentile fire size (reported in acres). |
State 99th Percentile Fire Size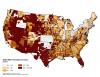 |
State 99th percentile fire size (reported in acres). |
State and Federal Area Burned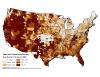 |
|
State Annual Average Area Burned |
State Annual average of area burned per hundred square miles. |
State Median Fire Size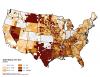 |
State median fire size (reported in acres). |
Suburban Factor Score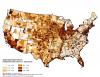 |
WUI factor score (weighted toward urban or % agriculture) |
Surface Fuel Clusters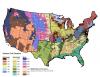 |
Statistical clustering of LANDFIRE's Fuel Loading Model (FLM) surface fuel classification system. |
Terrain Factor Score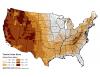 |
Physical environment factor score weighted to terrain and summer precipitation. |
Timber Jobs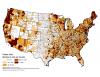 |
Number of forest industry jobs. |
Total Hotspots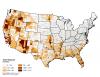 |
Total count of hotspots. |
Total Population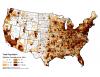 |
Total population (normalized by number/square mile) by county. |
Urban Influence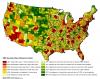 |
Urban economic influence from USDA ERS County typology codes |
Vegetation Clusters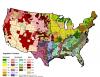 |
Statistical clustering of LANDFIRE's existing vegetation types grouped by U.S. NVCS Subclass. |
Warmness Factor Score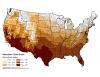 |
Physical environment factor score weighted to seasonal temperature. |
Wetness Factor Score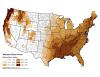 |
Physical environment factor score weighted to seasonal precipitation |
Wilderness or Inventoried Roadless Areas (Acres)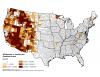 |
Acres in wilderness or inventoried roadless areas. |
Wilderness or Inventoried Roadless Areas (County Area)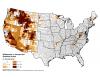 |
Percent of county in wilderness or inventoried roadless areas. |
Wildfire - Prescribed Fire Ratio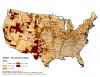 |
Ratio of area burned by wildfire and prescribed fire. Areas with lower values have a greater proportion of area burned by prescribed fire than wildfire and areas with higher values have a greater proportion of area burned by wildfire than by prescribed fire. wildfire-rx fire ratio = log10(area burned in wildfire) - log10(area treated with Rx fire) |
WUI Area Factor Score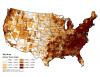 |
WUI factor score weighted towards the county area in the WUI (Silvis Lab, Univ. Wisconsin). |
WUI Growth (1990-2000)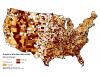 |
Percent Growth in WUI area from 1990-2000 |
WUI Home Density Factor Score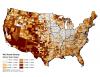 |
WUI factor score weighted towards the percentage of homes in the WUI (Silvis Lab, Univ. Wisconsin). |
WUI Housing Units (Percent in WUI)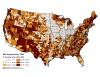 |
Percentage of all housing units in the County that are within the WUI, based on SILVIS 2000 WUI Statistics. |
WUI Interface (Percent)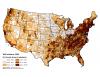 |
Percent of county area within the WUI interface, based on SILVIS 2000 WUI Statistics. |
WUI Interface Housing Units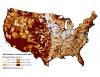 |
Number of housing units per square km in the WUI Interface, based on SILVIS WUI Statistics for 2000. |