National Priorities
The second element of this National Strategy involves prioritizing which activities will be emphasized where, from a national perspective. The vision and national goals are reaffirmed in Chapter 1 of the written report. Four national challenges emerge through an understanding of regional and national issues, as described in the National Characterization section. The opportunities explored in the Challenges and Opportunities section suggest a broad range of actions that could advance the national goals and highlights areas where specific actions are likely to be most effective. Prioritization involves stepping back and looking at potential actions thematically and in a broader context. The concept of a national priority for thematic actions follows the premise that concerted actions are most likely to be efficient or effective in areas where conditions contributing to an issue are most acute. 
Figure 4.2When implemented, the national priorities support progress toward each of the three national goals.
Figure 4.2 illustrates the basic relationship between national goals, challenges, options, spatially prioritized opportunities, and national priorities.
The attributes of counties falling within each combination of community clusters and landscape classes were considered relative the four national challenges. The match between county characteristics and thematic actions were then used to suggest relative priorities from a national perspective. The general process was to identify a subset of landscape classes or community clusters that were associated with higher or more troublesome levels of the variables of interest. The intersection of these identified classes and clusters created a high-priority combination class. Second-tier sets of clusters or classes were also identified and used similarly to indicate combination classes that would receive second- or third-level priorities.
Vegetation and Fuels
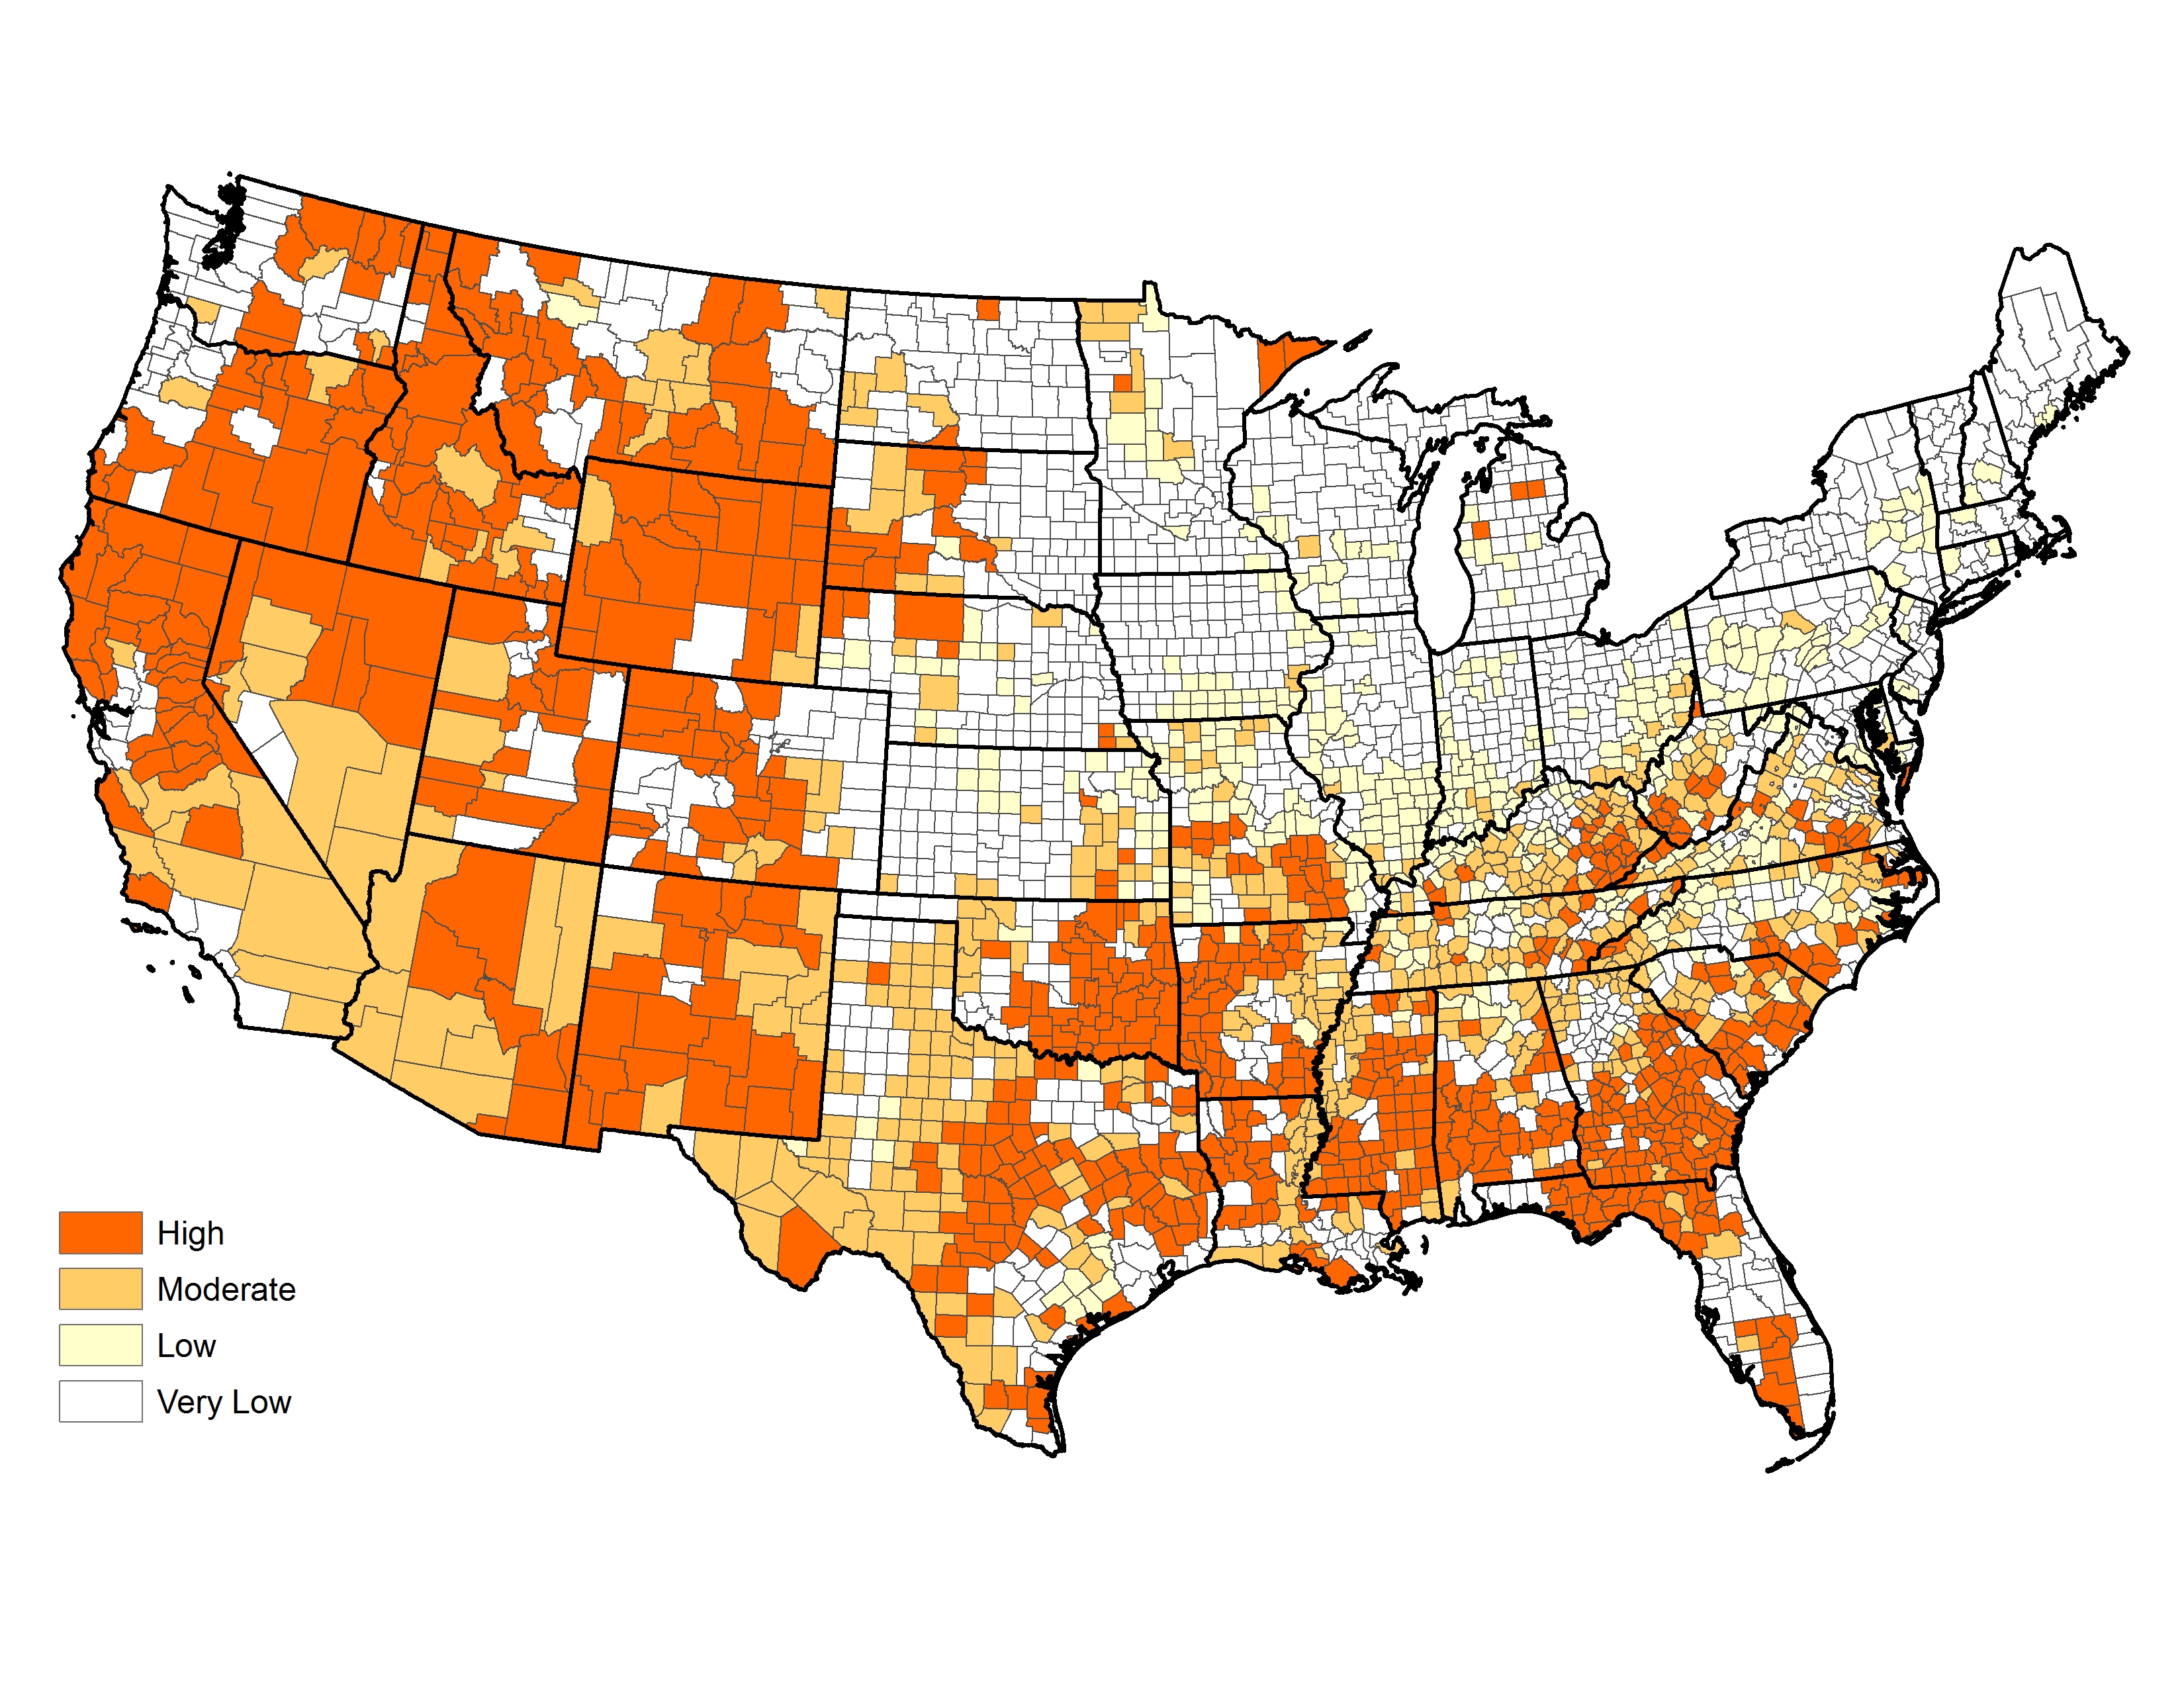
Figure 4.3
National prioritization of areas for broad-scale fuels management (as distinct from hazard reduction in proximity to structures) suggests a primary emphasis in the West and Southeast (figure 4.3). These included counties with the highest level of wildfire, fire-adapted native vegetation, and communities concentrated within a broader wildland landscape. Each location would use the mix of options most suitable for local conditions, as described in Options 1-4.
Homes, Communities, and Values at Risk
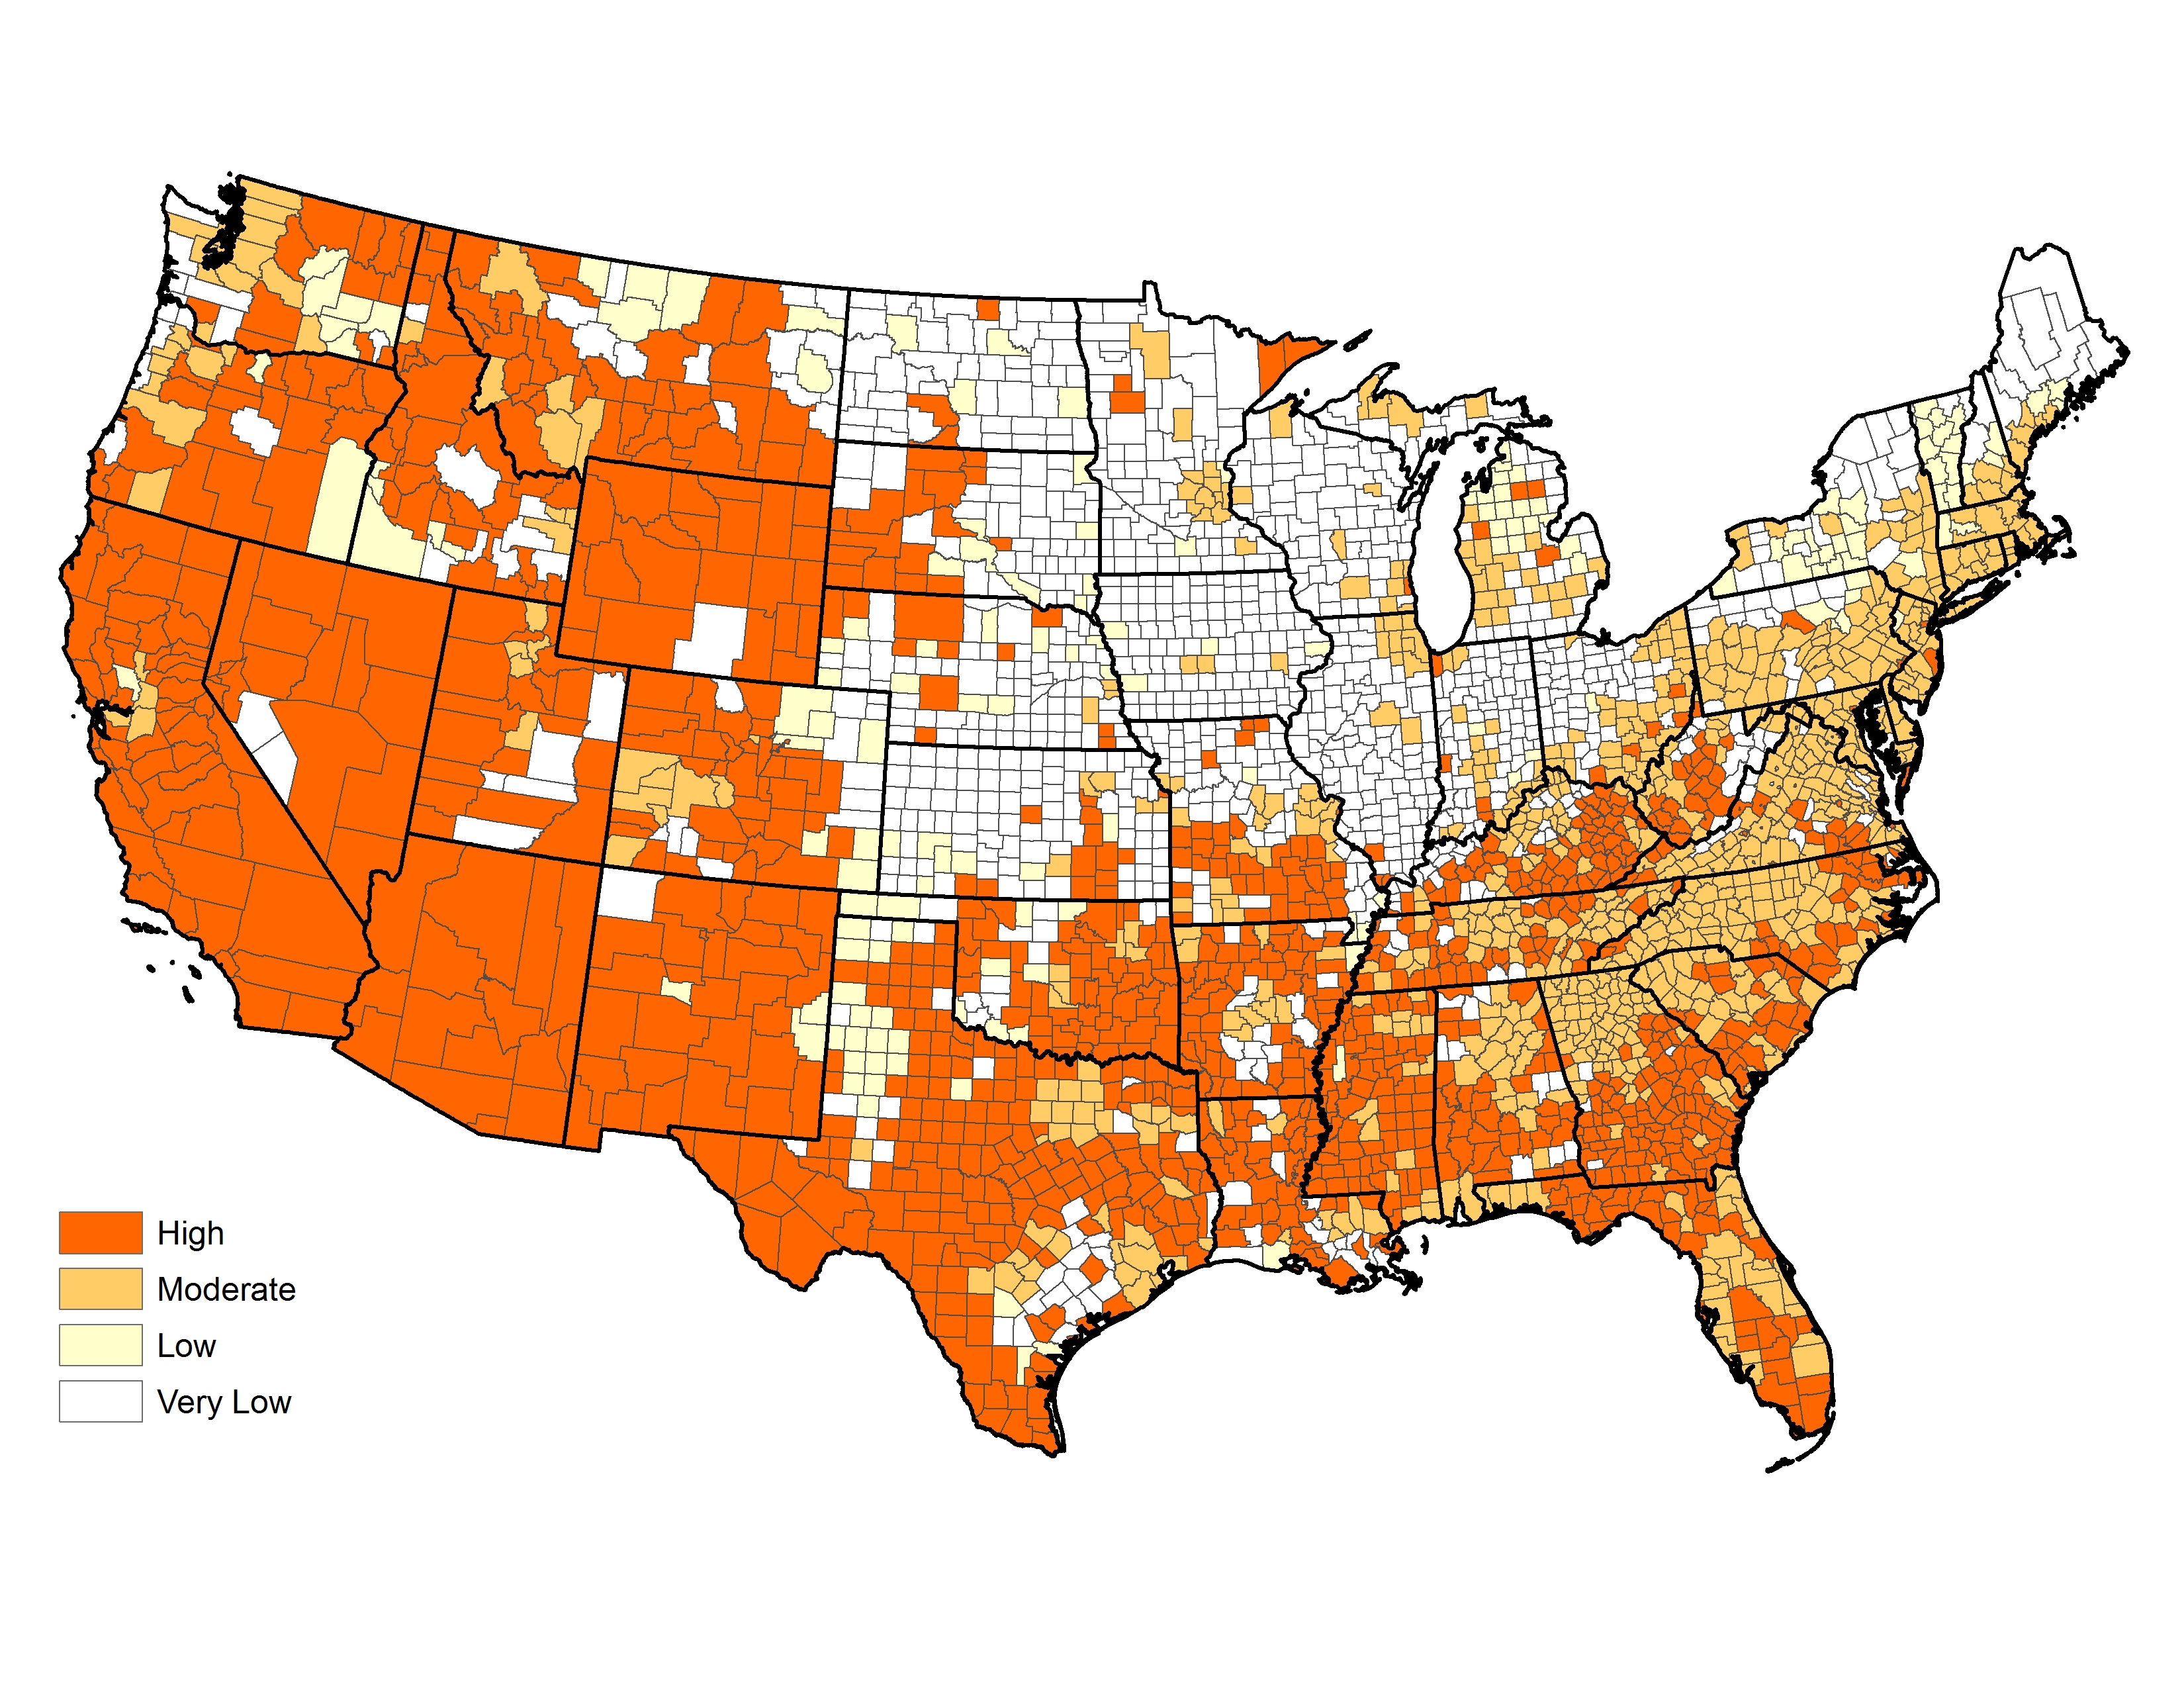
Figure 4.4
Candidate counties for national prioritization of community and individual homeowner action would include those described above under Options 6.a and 6.b, tempered by features of each landscape class (figure 4.4). Counties characterized by higher-than-average annual area burned, structures lost, and homes exposed within the WUI (especially in the West, South, and Southeast) were assigned the highest priority for community action.
Managing Human-Caused Ignitions
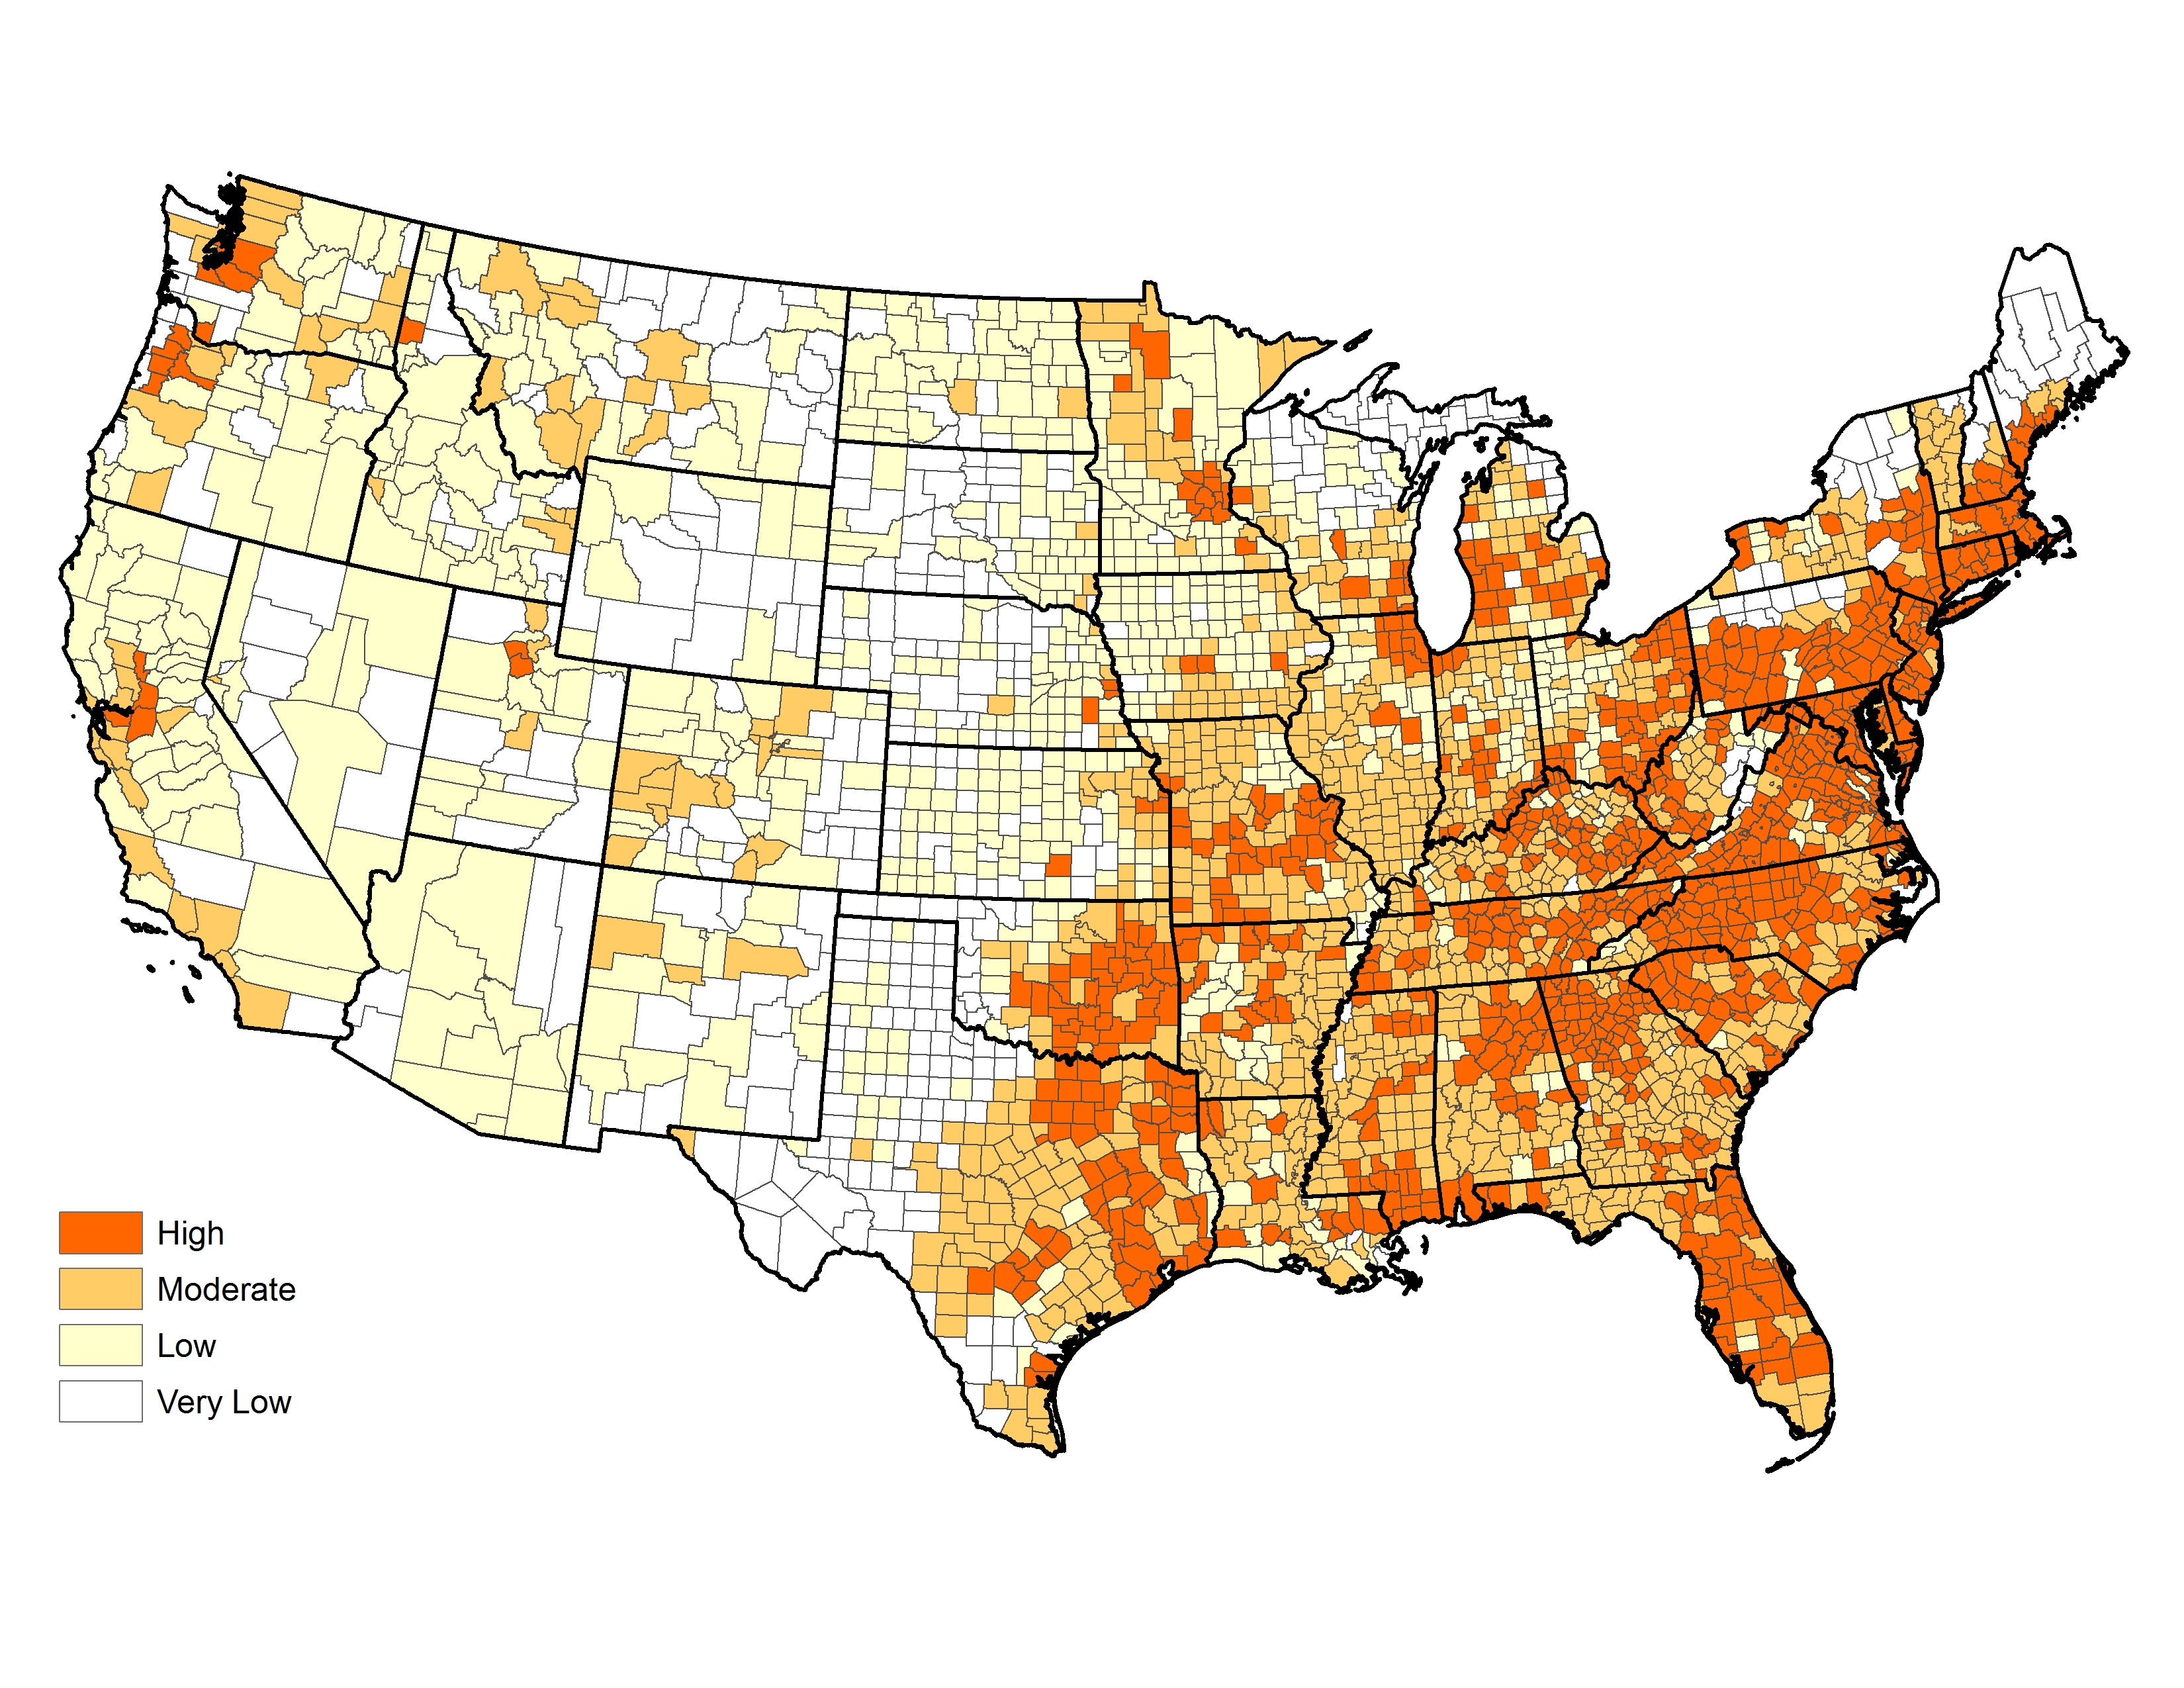
Figure 4.5
The available data on human-caused ignitions and their consequences identifies counties where human-caused ignitions dominate and lead to above-average area burned or buildings impacted by wildfires. These data suggest a prioritization that would target many eastern counties and populous western counties (figure 4.5).
Effective and Efficient Wildfire Response

Figure 4.6
From a national perspective, the primary challenges regarding suppression response are centered on issues surrounding large, long-duration wildfires. This is certainly not to discount or say that local response issues are unimportant. Indeed, all wildfires begin as local response events. It also is a misnomer to talk about priorities whenever large wildfires are concerned. In truth, all large wildfires are high-priority wherever they occur because of their unparalleled potential for harm. Conversely, large wildfires also have considerable potential for ecological benefits because of the extensive areas that they affect. Thus, an ideal national prioritization map would show where large wildfires are likely to occur, where they are likely to have negative overall social or ecological effects, and where they would likely produce positive resource benefits. Such a map would be extremely useful for prepositioning of response resources, planning containment or suppression tactics, and even planning for post-fire rehabilitation.
Unfortunately, creating such a map using the relatively coarse scale of counties as mapping units is fraught with difficulty. Many of the positive or negative effects of wildfire depend on small-scale, site-specific conditions on the ground and local weather conditions under which the fire occurs. It’s common for areas to experience negative effects under extreme conditions, for example, but positive effects under low or moderate intensity fire. Sophisticated modeling exercises have been used elsewhere to address this complexity using higher resolution data, but introduce their own analytical shortcomings. Generally speaking, one can obtain a more precise analytical solution using higher resolution data, but there is no guarantee that the answer will be more accurate.
A relatively simple first approximation to the ideal map can be obtained by overlaying the map of large wildfire potential (Option 9, figure 3.16) with the opportunities map for managing wildfires for resource objectives (Option 2, figure 3.4). To simplify interpretation, large wildfire potential was divided into three categories and overlain with the Option 2 map. The composite five-color map (figure 4.6) shows areas with relatively low likelihood of experiencing large fires (white areas on map), areas with moderate likelihood of large wildfires combined with beneficial use potential (light yellow), and areas with high likelihood of large wildfires combined with beneficial use potential (gold).
The purpose of figure 4.6 is not to dictate the response or resource management objectives for all large or long-duration wildfires in these counties. All wildfires have to be managed in the specific context and locations in which they occur to ensure environmental issues and local conditions are addressed. Rather, the intent to suggest that there are significant areas where greater flexibility in the management of large wildfires might be used.
Conversely, there are broad areas where the resource benefits from large or long-duration wildfires are likely outweighed by other concerns. One key to being able to use greater flexibility is the ability to anticipate or quickly assess the risk posed from an individual event. Ironically, the current suppression capacity in some areas is inversely proportional to the likelihood of a wildfire creating positive ecological benefits. That is, organizations as a whole are most effective at controlling wildfires that are likely to be beneficial, and least able to contain those wildfires that are likely to be most damaging. The net result is that we may be extinguishing many fires with the greatest potential for good. Enhanced, rapid risk assessment tools that help inform incident response decisions could be highly beneficial in this context.