Community Clusters
The second national goal of the Cohesive Strategy is promoting fire-adapted communities. The wildfire risk to communities and values can be viewed as the intersection of three principal elements: wildfire occurrence and extent, homes and communities, and social and economic resources. The first simply captures the magnitude of the hazard posed by wildfire. The second and third reflect the principal values at stake. The values threatened include buildings, homes, infrastructure, public and firefighter safety, public health, and many of the benefits that communities derive from the landscapes around them.
Quantifying all of the values that could be threatened by wildfire across the Nation is impractical. The number and distribution of homes located within the WUI is often used as a surrogate for many of the tangible values at risk, a convention followed here. Homes do not capture all of the values that are affected by wildfire, but losing a home is one of the most profound human experiences outside of loss of life. The number of homes lost in a wildfire is often equated by the public with the magnitude of the overall damage, even though other values are clearly impacted.
The capacity of a community to prepare for, respond to, and recover from a wildfire event is also a critical concern. There is an emerging literature on the concept of social vulnerability to catastrophic events. Researchers have generally looked at a combination of demographic and economic information to assess the vulnerability of individuals, families, and communities. 
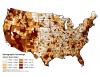
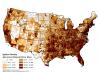
Figure 2.4Survey data on family incomes, education, and indicators of household stress were used to suggest relative vulnerability, while also considering metrics of economic activity within each county.
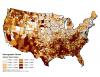
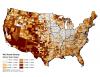
A statistical technique known as cluster analysis was used to group counties. Variables reflective of the amount of area in WUI and density of homes within it, demographic measures of household stress and economic advantage, and measures of area burned by wildfires and ignition density were used in the cluster analysis. Cluster analysis was used because it provided a cleaner separation of counties when considering all variables simultaneously, as opposed to sequentially as in a classification tree.
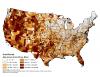
The result of the cluster analysis is a set of eight “community clusters” that are simply numbered 1 to 8 in no particular order. Simple labels were assigned based upon the distribution of key variables within each community cluster (figure 2.4).

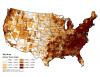
Figure 2.5All community cluster types can be found in each of the three geographic regions, albeit in decidedly different proportions (figure 2.5). Geographical affinity of several clusters is apparent, but is not as strong as with the resiliency classes. This result highlights the fact that there are counties with similar fire histories, WUI patterns, and socioeconomic attributes scattered throughout the country. Community clusters were used to develop narratives that in turn are used in the discussion of policy options below, complementing the landscape classes (refer to the online Cohesive Strategy data and tools library for complete description of the community cluster narratives).
Conclusion: Counties have been grouped using a relatively small set of variables into various “community clusters” that share common attributes. Examining multiple variables reveals both similarities and differences in community wildfire risk among counties.
View Individual Community Clusters
Input Variables
Data sets used in a statistical analysis or classification methodology to produce the variable above.