Reduce Accidental Ignitions

Data explanation:
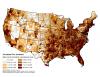
High Ignitions, High Area Burned [Accidental and Unknown Ignitions >3.878 and Area Burned >54.347]
High Ignitions, Low Area Burned [Accidental and Unknown Ignitions >3.878 and Area Burned <54.347]
Low Ignitions, High Area Burned [Accidental and Unknown Ignitions <3.878 and Area Burned >54.347]
Low Ignitions, Low Area Burned [Accidental and Unknown Ignitions <3.878 and Area Burned <54.347]
The first option highlights counties where the intent or focus would be to substantively reduce the number of accidental ignitions (Option 5.a, figure 3.13). Counties were divided into two classes based on ignitions: those with either higher or lower than normal numbers of human-caused incidents (the median is used to define “normal”). Similarly, counties were split based on the area burned by human-caused ignitions relative to the national median. Combinations of these two divisions were used to create a four-color map of the Nation. Counties falling into the high-high combination are found predominantly in the southeastern and south-central states and in the far West. The Northeast has a high percentage of the high-ignition-density, low-area-burned counties, while the interior West displays the bulk of the low-ignition-density, high-area-burned counties.
Input Variables
Data sets used in a statistical analysis or classification methodology to produce the variable above.