Input Variable Maps
209 Structures Lost (Number)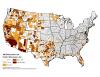 |
Cumulative structures lost 2002-2011 reported in 209 reports. |
209 Structures Lost (Rate)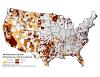 |
Structures Lost per 1,000 Acres burned, based on 209 data and State and Fed incidents |
Accidental Area Burned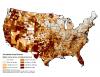 |
Mean annual area burned from unknown and accidental causes, normalized by area. |
Accidental Fire Incidents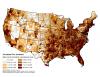 |
Mean annual number of incidents from unknown and accidental causes, normalized by area |
Annual Average Reported Federal Incidents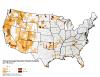 |
Annual average of reported federal incidents (per 100 sq mi). |
Annual Average Reported NFIRS Incidents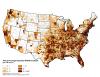 |
Annual average of reported NFIRS incidents (per 100 sq mi). |
Annual Average Reported State Incidents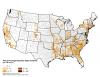 |
Annual average of reported state incidents (per 100 sq mi). |
Area Burned by Natural Ignitions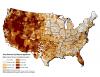 |
Area burned by fires started by natural causes, normalized by county area. |
Area Forested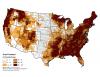 |
Percent of county area with forested landcover. This variable was used as an input to the Landscape Classes. |
Community Clusters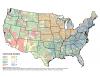 |
Community cluster based on eight clusters. |
Estimated Prescribed Fire Activity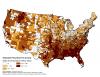 |
Estimated area burned in Rx fire, 2008-2011, based on hotspots and total area burned. Normalized by area. Units are log10[ac] per 100 sq mi. |
Federal 95th Percentile Fire Size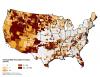 |
Federal 95th percentile fire size. |