Input Variable Maps Socioeconomic
Children Below Poverty Line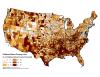 |
Children below the poverty line - Percentage of children in the county that are below the poverty threshold. |
Community Clusters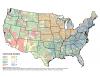 |
Community cluster based on eight clusters. |
Demographic Advantage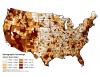 |
Demographic factor score of socioeconomic factors such as poverty rates, household income, population growth and educational attainment. |
Demographic Stress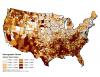 |
Demographic factor score of socioeconomic factors such as poverty rates, household income, population growth and educational attainment. |
Dominant Economic Activity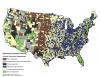 |
Dominant economic activity from the USDA Economic Research Service's ERS County typology codes. |
Families Below Poverty Line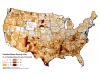 |
Families below the poverty line - Percentage of families in the county that are below the poverty threshold. The income threshold for poverty varies by family size, number of children and age of the householder. |
Forest Industry Jobs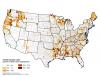 |
Forest industry jobs (% of total county employment) |
Forest Industry Jobs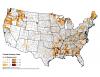 |
Forest industry jobs (% of total county employment) |
Forest Product Production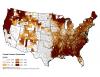 |
Index of forest product production. |
Housing Stress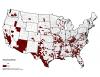 |
Counties where 30 percent or more of households had one or more of these housing conditions in 2000: lacked complete plumbing, lacked complete kitchen, paid 30 percent or more of income for owner costs or rent, or had more than 1 person per room in 2000. |
Low Educational Attainment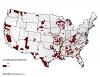 |
Counties with 25 percent or more of residents 25-64 years old with neither a high school diploma nor GED in 2000. |
Low Employment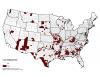 |
Counties where less than 65 percent of residents 21-64 years old were employed in 2000. |
Median Income of Families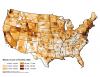 |
American Community Survey, 2005-2009, median income of families (USD). A family includes a householder and one or more individuals related to the householder by birth, marriage or adoption. |
Percent of Population Over 25 With Bachelor's Degree or Higher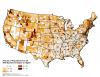 |
American Community Survey, 2005-2009, percent of population over 25 years of age with Bachelors degree or more. |
Persistent Poverty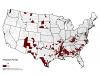 |
20 percent or more of residents in poverty as measured by each of the last 4 censuses, 1970, 1980, 1990, 2000, and 2010. |
Population Growth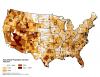 |
Annualized population growth from 1990-2010 |
Population Loss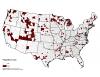 |
Counties where the number of residents declined both between the 1980 and 1990 censuses and between the 1990 and 2000 censuses. |
Socioeconomic Stress Index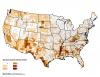 |
Index based on the sum of Persistent Poverty, Housing Stress, Low Employment, Low Educational Attainment, and Population Loss. |
Timber Jobs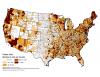 |
Number of forest industry jobs. |
Total Population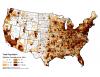 |
Total population (normalized by number/square mile) by county. |
Urban Influence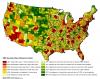 |
Urban economic influence from USDA ERS County typology codes |